
Search for UK university acceptance rates and you will meet two numbers that seem to contradict each other. One says the average UK university admits about a third of its applicants. The other, from UniLink's 2026 analysis of acceptance by country of origin, says international applicants succeed about 61.5 percent of the time. Both are real. They measure different things, and confusing them is how applicants talk themselves into the wrong shortlist.
The first number: published institutional rates
These are the rates universities publish for their whole applicant pool, domestic and international together. In our dataset of 45 UK universities, only 12 publish one: the University of Manchester at 56 percent, the University of Bath and the University of Warwick at 50, Durham University at 45, University College London and the University of Edinburgh at 40, the University of Cambridge at 21, the University of St Andrews at 20, the University of Oxford at 17.5, Imperial College London at 14.3, King's College London at 13 and the London School of Economics at 9. Their mean is 31.3 percent. The other 33 UK universities in our data publish nothing, a silence our explainer on UK averages also runs into.
The second number: rates by applicant origin
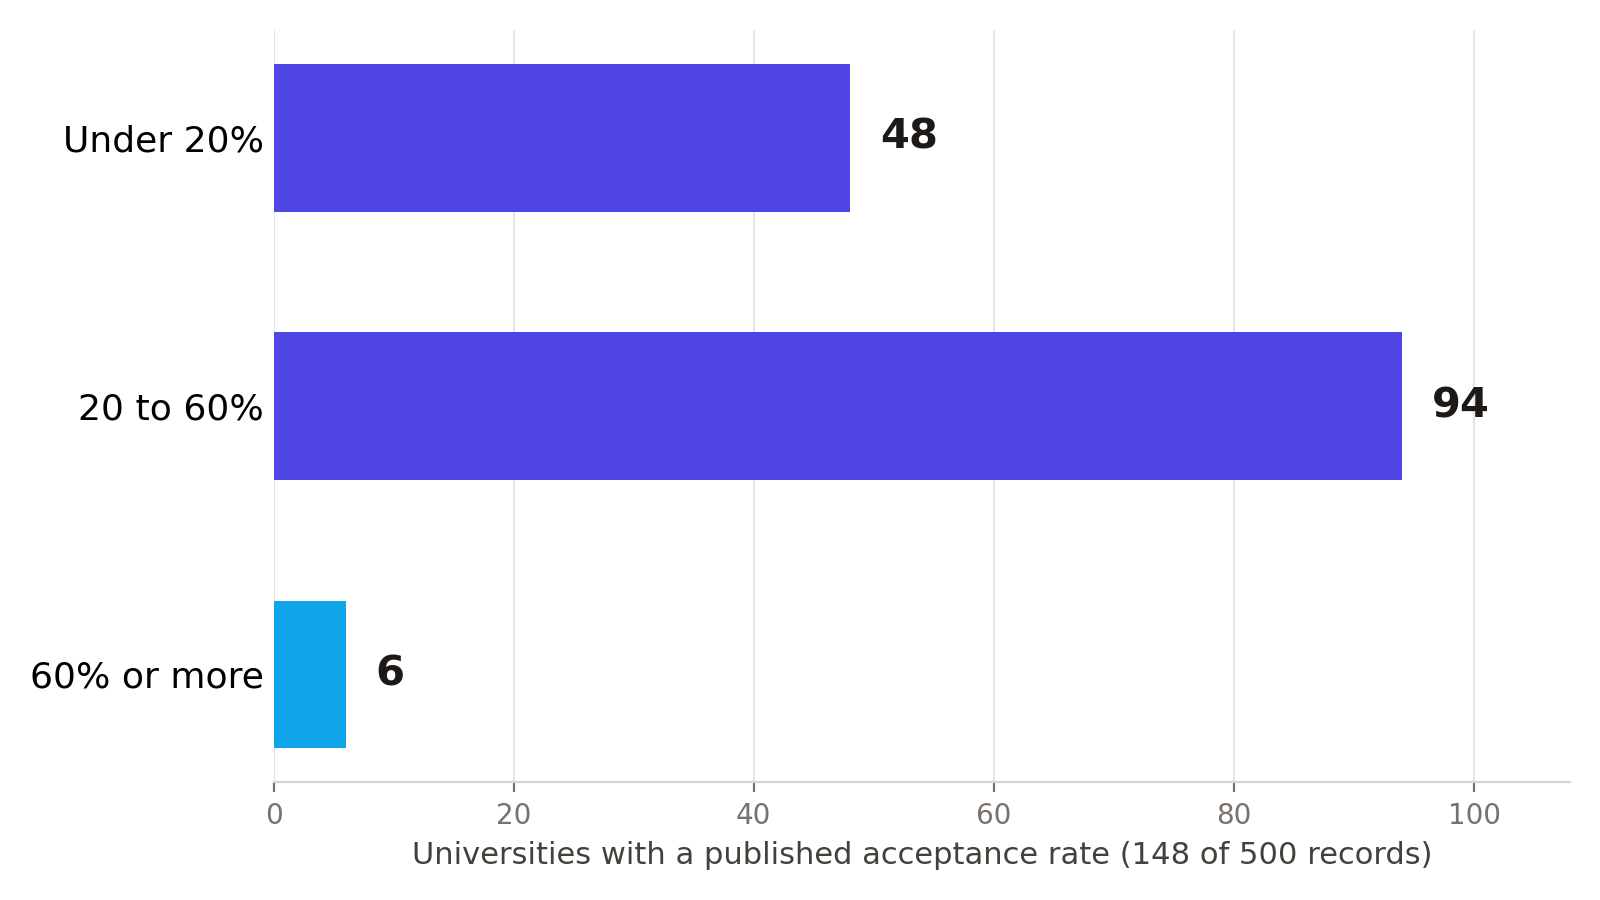
UniLink's analysis works from the application side: for applicants from each country, what share received offers. Its 2026 figures put the overall international rate near 61.5 percent, with applicants from the United States at 72 percent, EU applicants at 68, China near 54 and India near 47, and it reports a Russell Group average of 48 percent. Those are application-system statistics, built from application and offer counts, and they describe pools of applicants, not institutions.
Why the two numbers differ
Three reasons. The denominators differ: the institutional rate divides by everyone who applied, including the large domestic pool, while the origin rate divides only by one country's applicants. The course mix differs: international applicants cluster in postgraduate and business courses that admit at higher rates than the undergraduate degrees dominating the institutional pool. And self-selection differs: students who apply across an ocean have usually already filtered themselves against the entry requirements. Neither number is your number. Your real rate is set by one course, at one university, against one year's pool, which is why a university-wide figure, from either family, is a screening tool and not a prediction.
What to do with both
Use the published institutional rates to sort universities into reach, match and safety bands, which is what the Balanced Shortlist Builder does with the 12 published UK rates, flagging the 33 silent ones rather than guessing them. Use the origin analysis to calibrate expectations for your country's pool, and to understand why a university that looks forbidding at 14 percent overall may still admit a healthy share of well-matched international applicants to a specific course. Then do the only check that settles it: the entry requirements and offer history of the exact course you want, a method we walk through for one university in detail here.